

こちらで紹介しているコードは、改変・転載・二次配布等は全てOKです。常識の範囲内でご活用ください。また、コードが動作しない時は一報いただけると助かります。
使い方
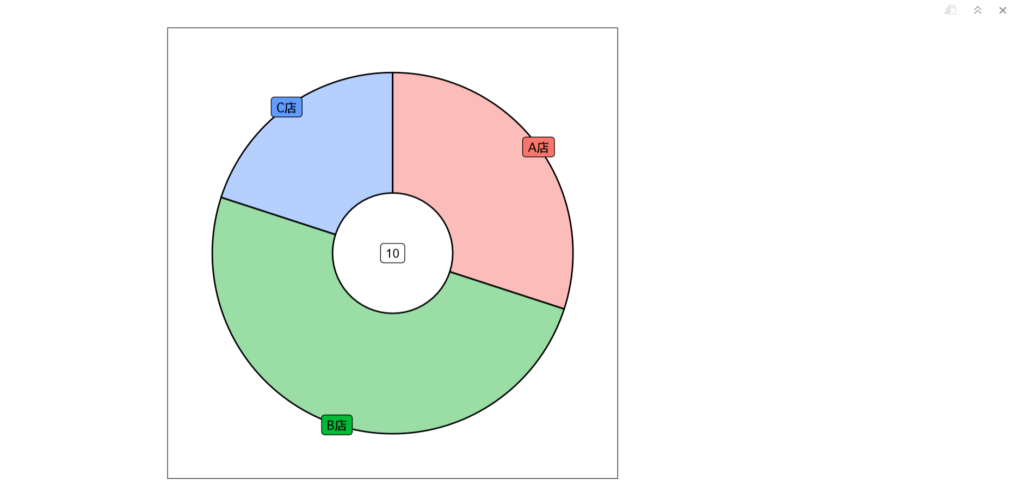
Example
サンプルデータの準備
tbl <- tibble(
  Category = c('A店', 'B店', 'C店'),
  Value = c(3, 5, 2),
)
サンプルコード
render_donut(tbl,
             fill = Category,
             value = Value,
             label = Category,
             alpha = 0.5,
             family = 'Osaka')
出力結果
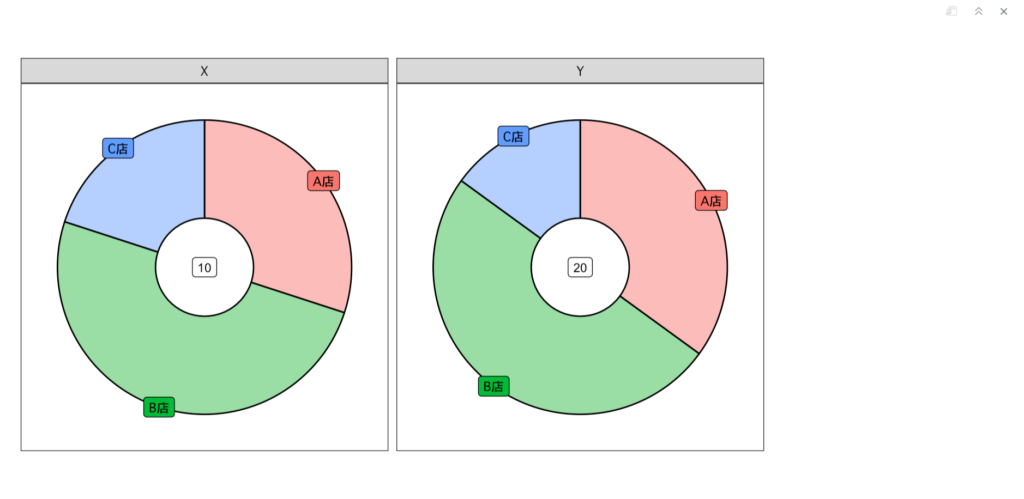
Example with panels
サンプルデータの準備
tbl2 <- tibble(
  Group = c('X', 'X', 'X', 'Y', 'Y', 'Y'),
  Category = c('A店', 'B店', 'C店', 'A店', 'B店', 'C店'),
  Value = c(3, 5, 2, 7, 10, 3),
)
サンプルコード
render_donut(tbl2,
             Group,
             fill = Category,
             value = Value,
             label = Category,
             alpha = 0.5,
             family = 'Osaka') +
  facet_wrap(. ~ Group)
出力結果
生成用コード
# install.package('tidyverse')
library(tidyverse)

# Rendering a donut chart
render_donut <- function(df, ..., fill, value, label = NULL, alpha = 1, font_size = 3, family = '') {

  # NSE
  cols_quo <- rlang::quos(...)
  fill_quo <- rlang::enquo(fill)
  value_quo <- rlang::enquo(value)
  label_quo <- rlang::enquo(label)

  # Check arguments
  if (!is.data.frame(df)) {
    stop('df must be a data frame')
  }

  # Function to get counts
  get_total_count <- function(df) {
    count(df, !!!cols_quo, wt = !!value_quo, name = 'total')
  }

  # Plot
  g <- ggplot(df, aes(y = !!value_quo, fill = !!fill_quo)) +
    geom_bar(stat = 'identity',
             position = position_fill(reverse = TRUE),
             aes(x = 2),
             color = 'black',
             alpha = alpha,
             width = 2) +
    geom_label(data = get_total_count,
               aes(x = 0, y = 0, label = total),
               color = 'black',
               fill = 'white',
               size = font_size) +
    coord_polar(theta = 'y') +
    xlim(0, 3) +
    theme_bw(base_family = family) +
    theme(legend.position = 'none',
          panel.grid = element_blank(),
          axis.title = element_blank(),
          axis.text  = element_blank(),
          axis.ticks = element_blank())

  # Only add the labels if label is not NULL
  if (!is.null(rlang::eval_tidy(label_quo, data = df))) {
    g <- g + geom_label(position = position_fill(vjust = 0.5, reverse = TRUE),
                        aes(x = 3, label = !!label_quo),
                        color = 'black',
                        size = font_size,
                        family = family)
  }

  # Return
  g
}
